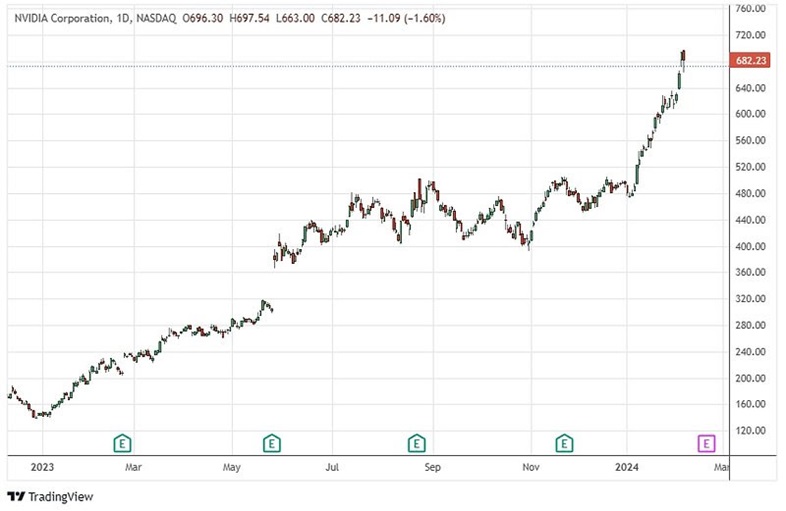
Nvidia Corporation (NVDA) has had a fantastic run higher this year, up 39% as of Feb. 6. Is it still a good buy though? Here is a fundamental and technical breakdown of NVDA’s stock.
First, the fundamentals help explain why NVDA has performed so well in the first place. The stock is up 1777% over the last five years and 228% over the last year.
Earnings per share (EPS) have increased an average of 35.5% per year over the last five years.
Analysts anticipate even bigger EPS growth going forward of 102.5% per year, including 63.6% EPS growth for 2024.
Sales have increased an average of 30.8% per year over the last five years.
The stock has an “A” financial health rating from Morningstar.
At a glance, the Price/Earnings ratio looks high at 90.3. Companies that are growing rapidly often have a high P/E because investors are willing to pay a higher price in anticipation of those higher future earnings, says Cory Mitchell, an analyst with Trading.biz.
If NVDA meets those expectations the P/E can normalize (come down) over time even with the stock price moving up or holding steady. Or the company fails to meet expectations, the stock price drops and the P/E normalizes that way.
The forward P/E which accounts for future earnings over the next year is 32.8. This shows that P/E can drop rapidly when accounting for higher (anticipated) earnings.
PEG Forward, which accounts for earnings growth over the next five years is 0.4. Fairly valued stocks are considered to have a PEG Forward of 1.0. Therefore, when accounting for growth, NVDA could be a bargain, trading at under fair value. Although, investors should never rely on just one metric for making a trading or investing decision.

NVDA Technical Outlook
In late 2022 to early 2023, NVDA rallied 66% and then moved sideways, experiencing two pullbacks near 10% and then drifting sideways to slightly higher over the next three and half months.
NDVA started moving more aggressively higher in May of 2023, including a big earnings jump late that month. The price rallied about 50% and then had staggered movement higher, once again experiencing 10% to 18% declines interspersed with rallies of similar magnitude. The price chopped sideways in this fashion for six months before commencing the latest rally in 2024.
While history doesn’t always repeat, during this 13-month rally moves of roughly 50% to 60% have been followed by choppier trading over the ensuing months. Pullbacks between 10% and 18% have occurred following such swift runs higher.
The company is expected to release earnings on Feb. 21. While some earnings announcements have been a catalyst for big moves higher over the last year, some have resulted in very little movement or were followed by price declines.
History may not repeat, but indicates waiting for a pullback in this stock which has already rallied sharply may be prudent.
The long-term outlook for the company still looks promising.
